-
A colleague of yours thinks that counting the digits in a sequence of random
numbers would be a good empirically randomness test. Independent of whether or
not your colleague's idea is a good one, describe the steps in the randomness
test implied by your colleague's idea.
The three steps in an empirical randomness test based on your colleague's idea are:
- Count and tally the digits in the sequence of random numbers.
- Compute the expected tallies for each digit.
- Use the expected and actual counts to perform a chi-square test with 9 degrees of freedom.
Most of the answers to this question were kinda sorta correct, although the details tended to get confused.
-
The following unweighted and weighted frequency histograms
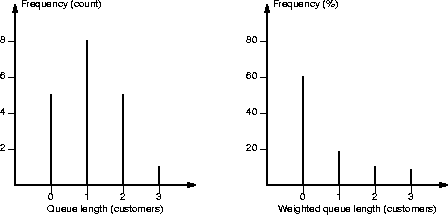 were both derived from data appearing in one of these three time histogram:
 Which one? Explain your reasoning.
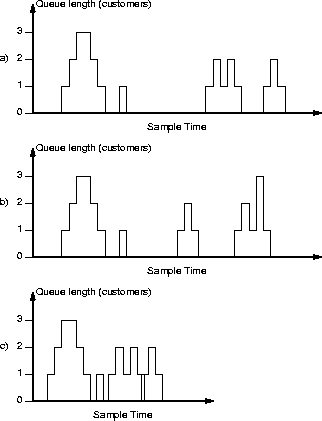
From the unweighted frequency histogram, the queue length was three only once, which is consistent with time histograms a and c, but not b, which shows the queue length at three twice.
From the weighted frequency histogram, it seems that the queue was empty more than half the time during the sample period. The time histogram a is more consistent than is time histogram c with respect to the queue being empty more than half the time, and it seems safe to conclude that the time histogram a provided the data for the frequency histograms.
A few answers didn't catch on that time histogram b had two occurrences of queue length 3, while the frequency histograms showed only 1 occurrence.
| This page last modified on 26 March 2005. |
|
